Visualising the sugar consumption of my family
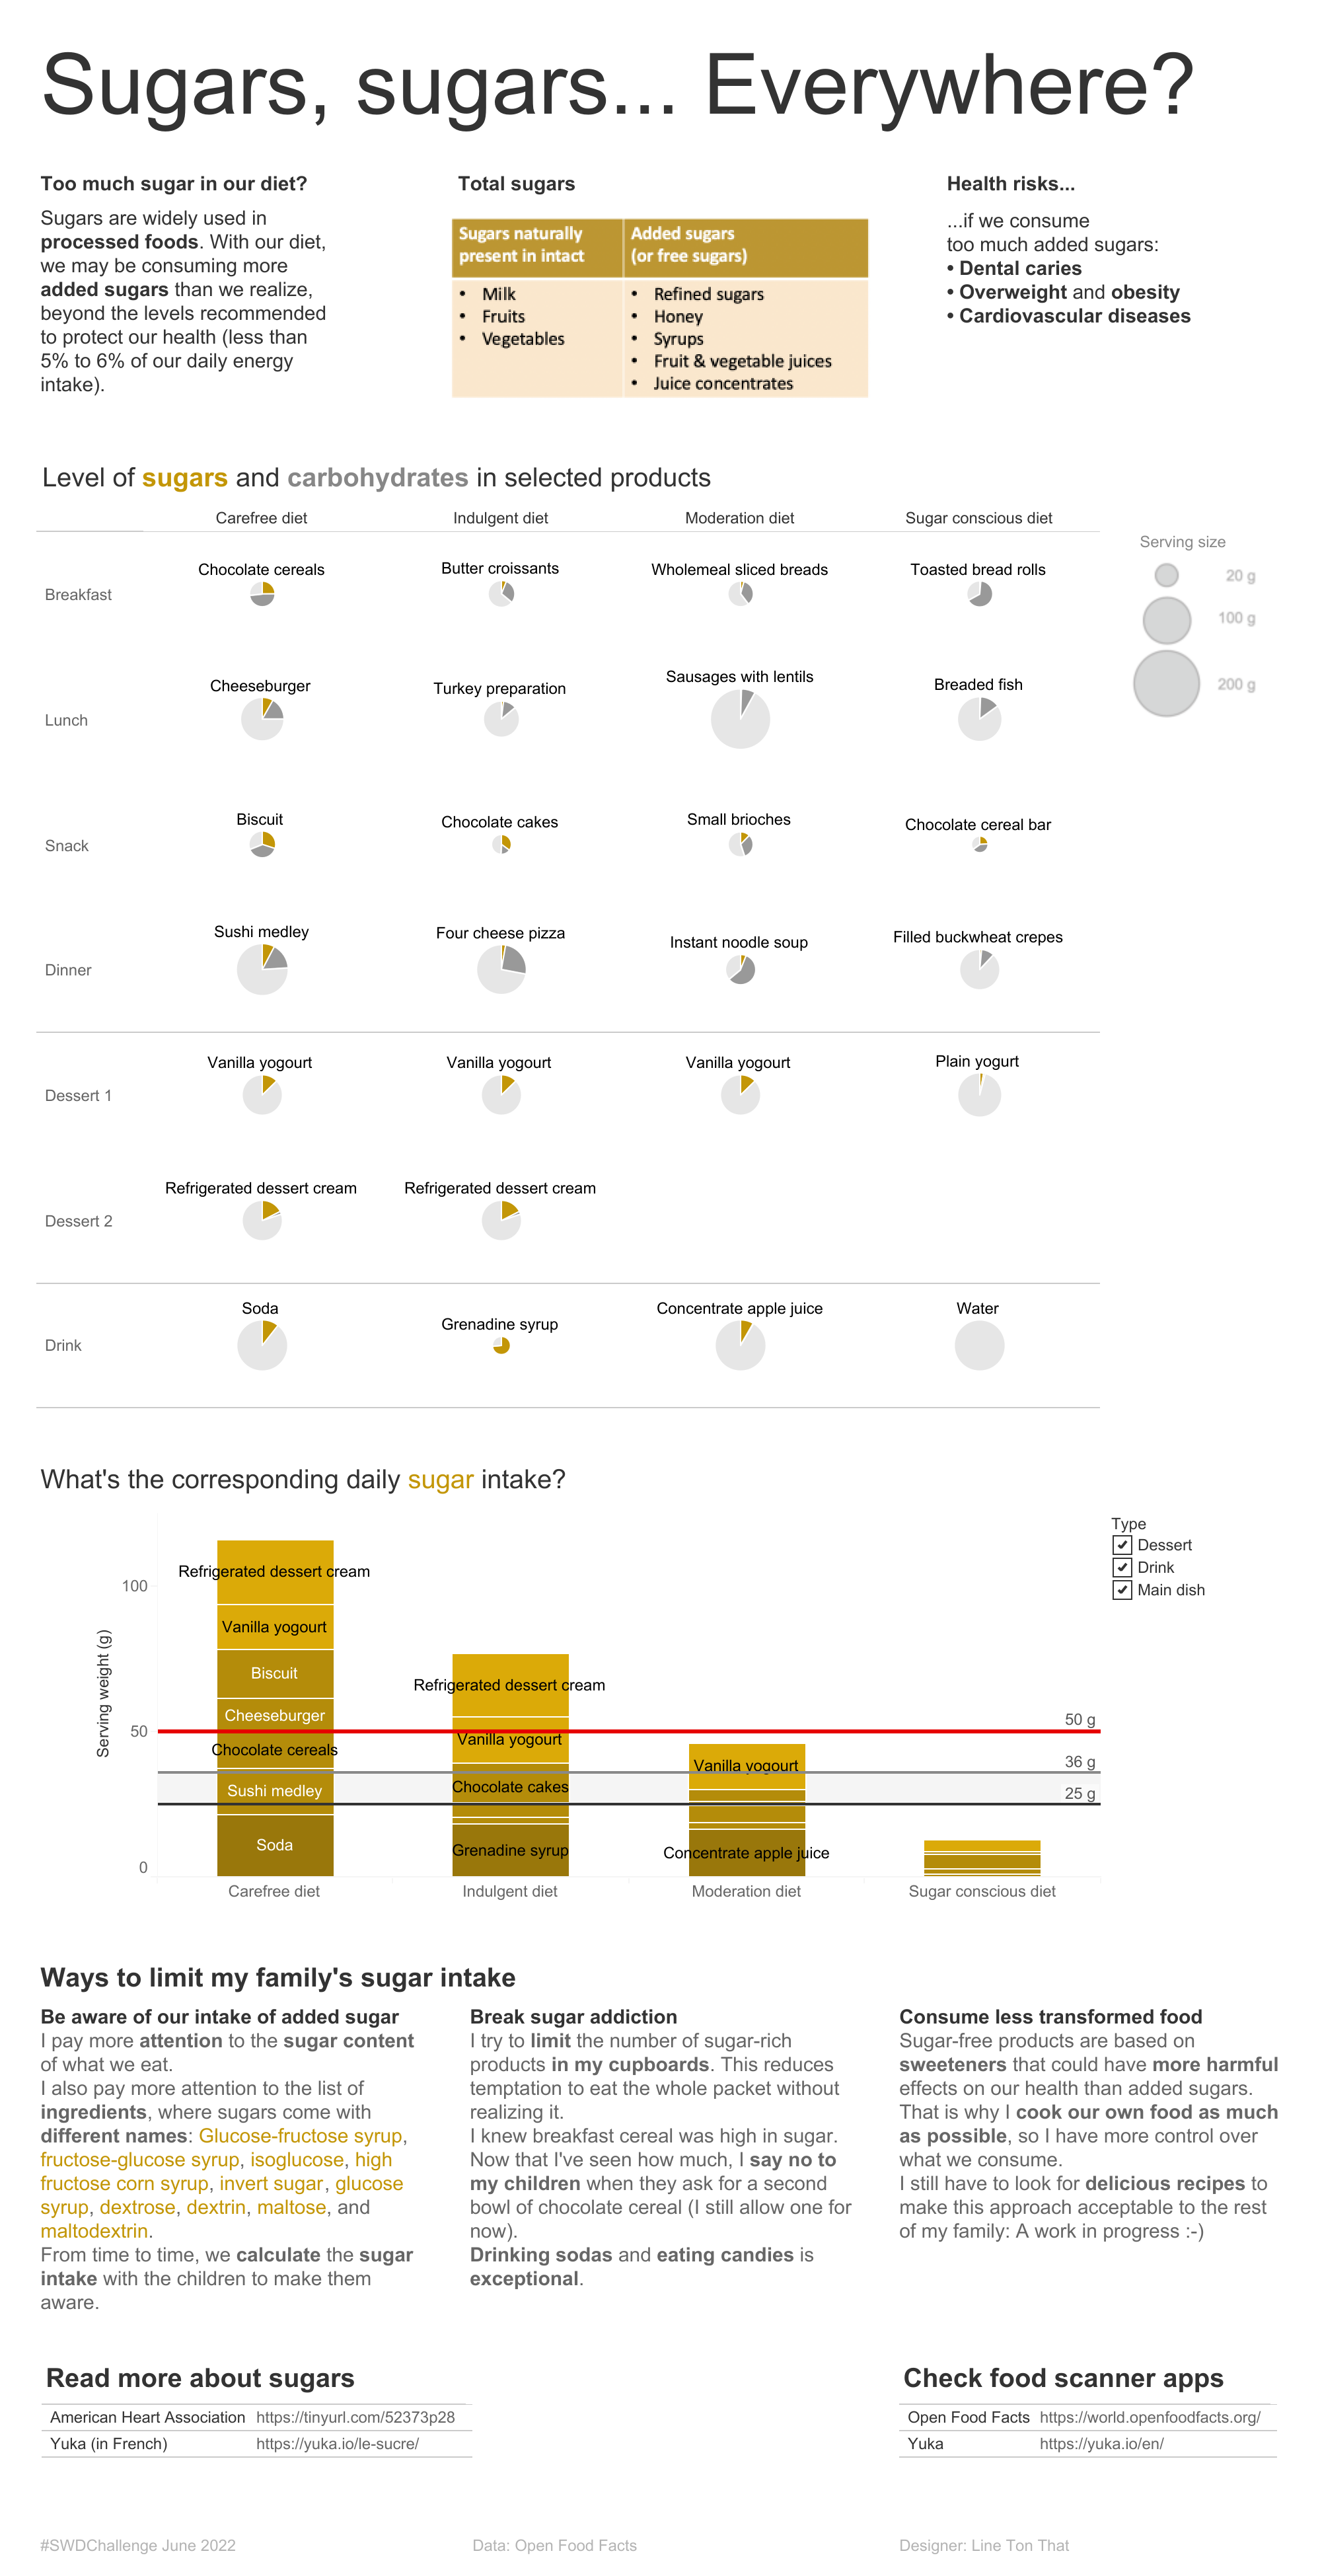
After hearing that sugars are widely available in processed foods, I decided to take a closer look at some of the products we typically consume in my family. My goal was to find out how much sugar we consume on a daily basis.
I collected the data from Open Food Facts. My children helped me measure some of the servings. I then built graphs using Tableau public to analyze the data, and created a dashboard to summarize my results.

Main design choices
OMG - Pie charts!!
To give an idea of the sugar content of each product, I decided to use a pie chart. The objective was to show whether sugar is present or not, and if it is present, to give a rough idea of the amount (less than 25%, less than 50%, less than 75%, more than 75%). The area is used to represent the size of the portion. I do not recommend using these pie charts to compare the sugar content of one product to another. A bar graph would be more effective.
This project met the requirements of the “Find the Exception (thoughtfully)” challenge hosted by the Storytelling with Data team. I used this project as a challenge submission.
I even tried putting the pie icon on a plate, but decided to save that idea for another version (for kids).
Guide the reader as much as possible
In order to facilitate the flow of information for the reader, I removed unnecessary interactions:
- In the original design, the reader could select which values to display per 100g or per serving. Only the portion size is really significant if we want to understand the total sugar consumption. Then, I displayed only the serving size.

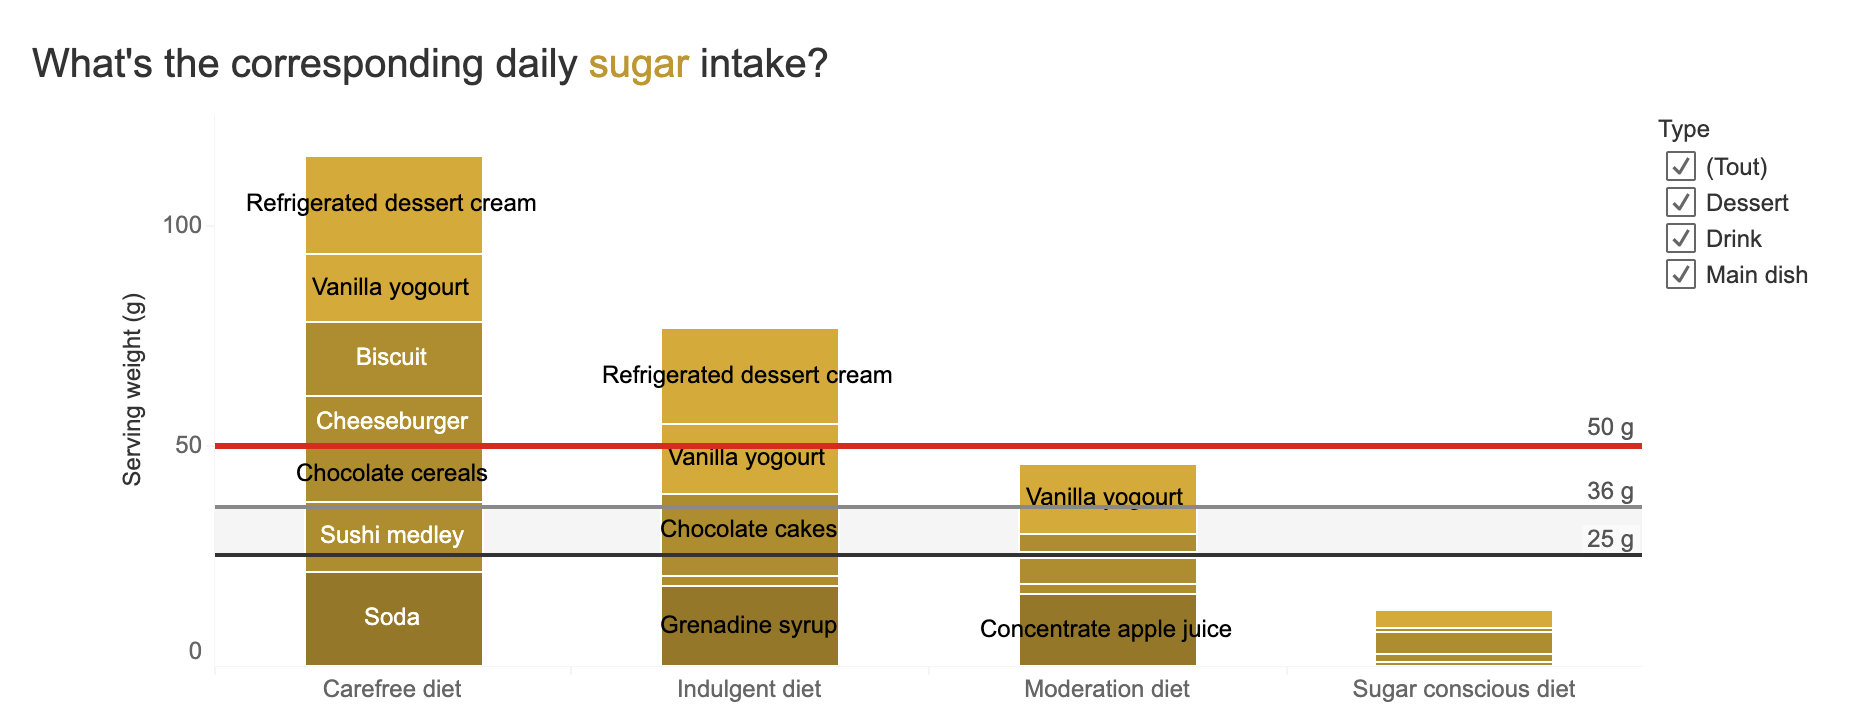
- My original idea was to let the reader make up his own diet, but that would have been irrelevant and distracting, since the idea was to present diets with typical ranges of sugar consumption. And to emphasize the fact that sugars add up quickly, leading to an unhealthy daily sugar intake.
- The labeling of the different diets, such as the “carefree diet”, also helps the reader to classify the different diets presented.
- There is no single recommended daily intake of sugar (see section below). Therefore, I have chosen to show different values than those from authoritative sources. I have used red for the World Health Organization’s upper limit. I have not used green anywhere, as the consumption of added sugars should be as low as possible.

Data used
- I had initially left out desserts, but their impact on sugar consumption was too great to leave out. I did not include candy, although my children do eat it from time to time.
- For time reasons, I chose individual products to represent an entire category of food products. It was also closer to the actual products consumed by my family.
Potential follow-up to the project
This project made me aware of how much sugar we actually consume, especially my children. It pushed me to take steps to reduce our sugar intake. Weighting portion sizes, calculating sugar consumption, and discussing the results with them has really made them aware of this issue.
I like how Open Food Facts has developed a nice game to raise awareness about sugar levels in processed foods. I could play it with my children.
Future versions of this data viz could include:
- a version for children, with less text and more pictograms,
- or a carousel with selected information.
This project also made me want to explore other aspects of our food. To be continued…
Additional information
What are the different kinds of carbohydrates and sugars?
Sugars are simple carbohydrates and generally have a sweet flavor. In the European Union, carbohydrates and sugars mentioned in the Nutrition Facts are defined as:
- Carbohydrate: any carbohydrate which is metabolised by humans, and includes polyols.
- Sugars: all monosaccharides and disaccharides present in food, but excludes polyols.
- Fibre: carbohydrate polymers with three or more monomeric units, which are neither digested nor absorbed in the human small intestine and belong to the following categories:
- edible carbohydrate polymers naturally occurring in the food as consumed,
- edible carbohydrate polymers which have been obtained from food raw material by physical, enzymatic or chemical means and which have a beneficial physiological effect demonstrated by generally accepted scientific evidence,
- edible synthetic carbohydrate polymers which have a beneficial physiological effect demonstrated by generally accepted scientific evidence.
Hugo Blanc, a nutritionist, provides examples of carbohydrates in this article:
| Carbohydrate | Number of sugar molecules | Examples |
|---|---|---|
| Monosaccharide | 1 | Fructose, galactose, ribose, glucose |
| Disaccharide | 2 | Lactose (milk sugar), sucrose (cane sugar, beet sugar), trehalose and maltose (malt sugar) |
| Oligosaccharide | 3 to 8 | Maltodextrine |
| Oligosaccharide | > 9 | starches (amylopectin, amylose) and fibres (cellulose and pentosans) |
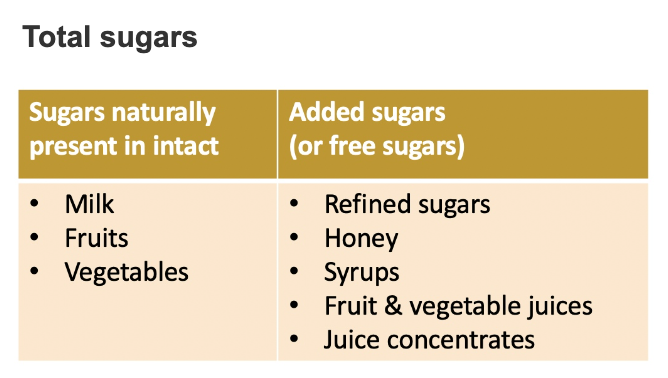
Total sugars can be divided into 2 sub-categories:
- Sugars naturally present in intact fruits, vegetables, and milk
- Free sugars (term used by the WHO) or added sugars (terms used by the American Heart Association).
The second category include refined sugars, as well as sugars naturally present in honey, syrups, fruit & vegetable juices and juice concentrates.

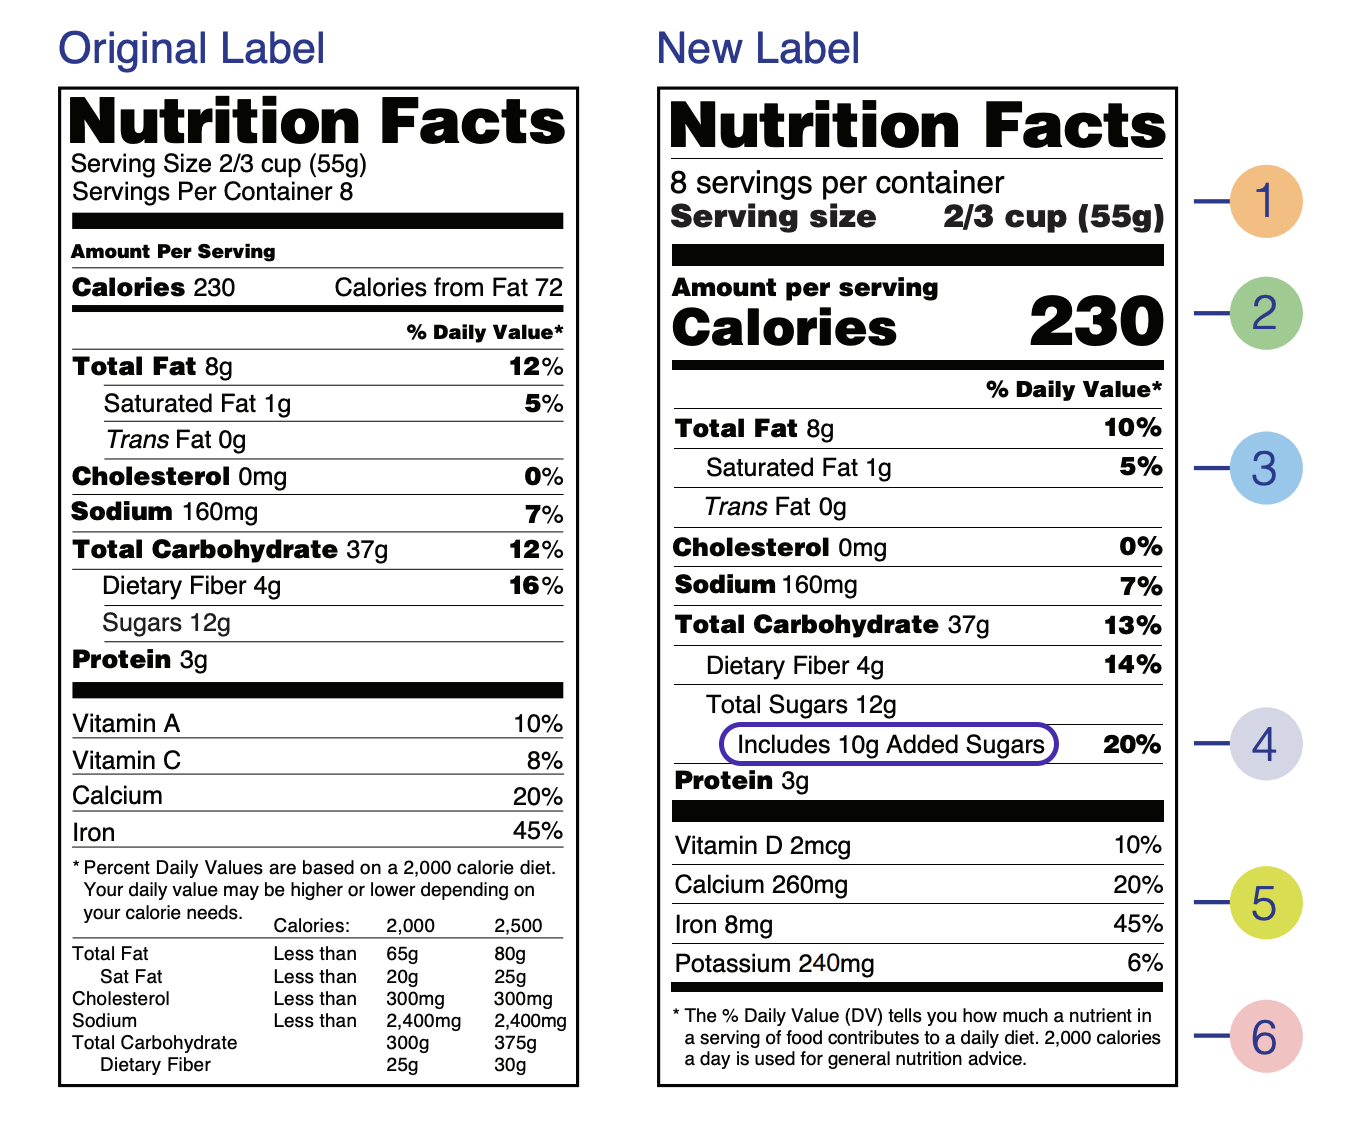
While the nutrition facts label in France includes Carbohydrates and Total sugars, the
new nutrition facts label in the US now also has an additional line for Added sugars, as illustrated below. The US version makes it easier to know the exact quantity of added sugars.
 Source: U.S. Food and Drug Administration
What’s the recommended daily sugar intake?
Most recommended daily sugar intakes provided by authoritative sources are based on the daily energy requirements. These requirements depend mainly on the age, weight, and level of physical activity.
Here are the maximal daily sugar intakes recommended for adults by authoritative sources:
| Source | Maximal daily sugar intake (g) |
|---|---|
| World Health Organization | 50 (upper), 25 (ideal) |
| American Heart Association | 36 (men), 25 (women) |
| ANSES | 100 |
| European Food Safety Authority | As low as possible |