Context
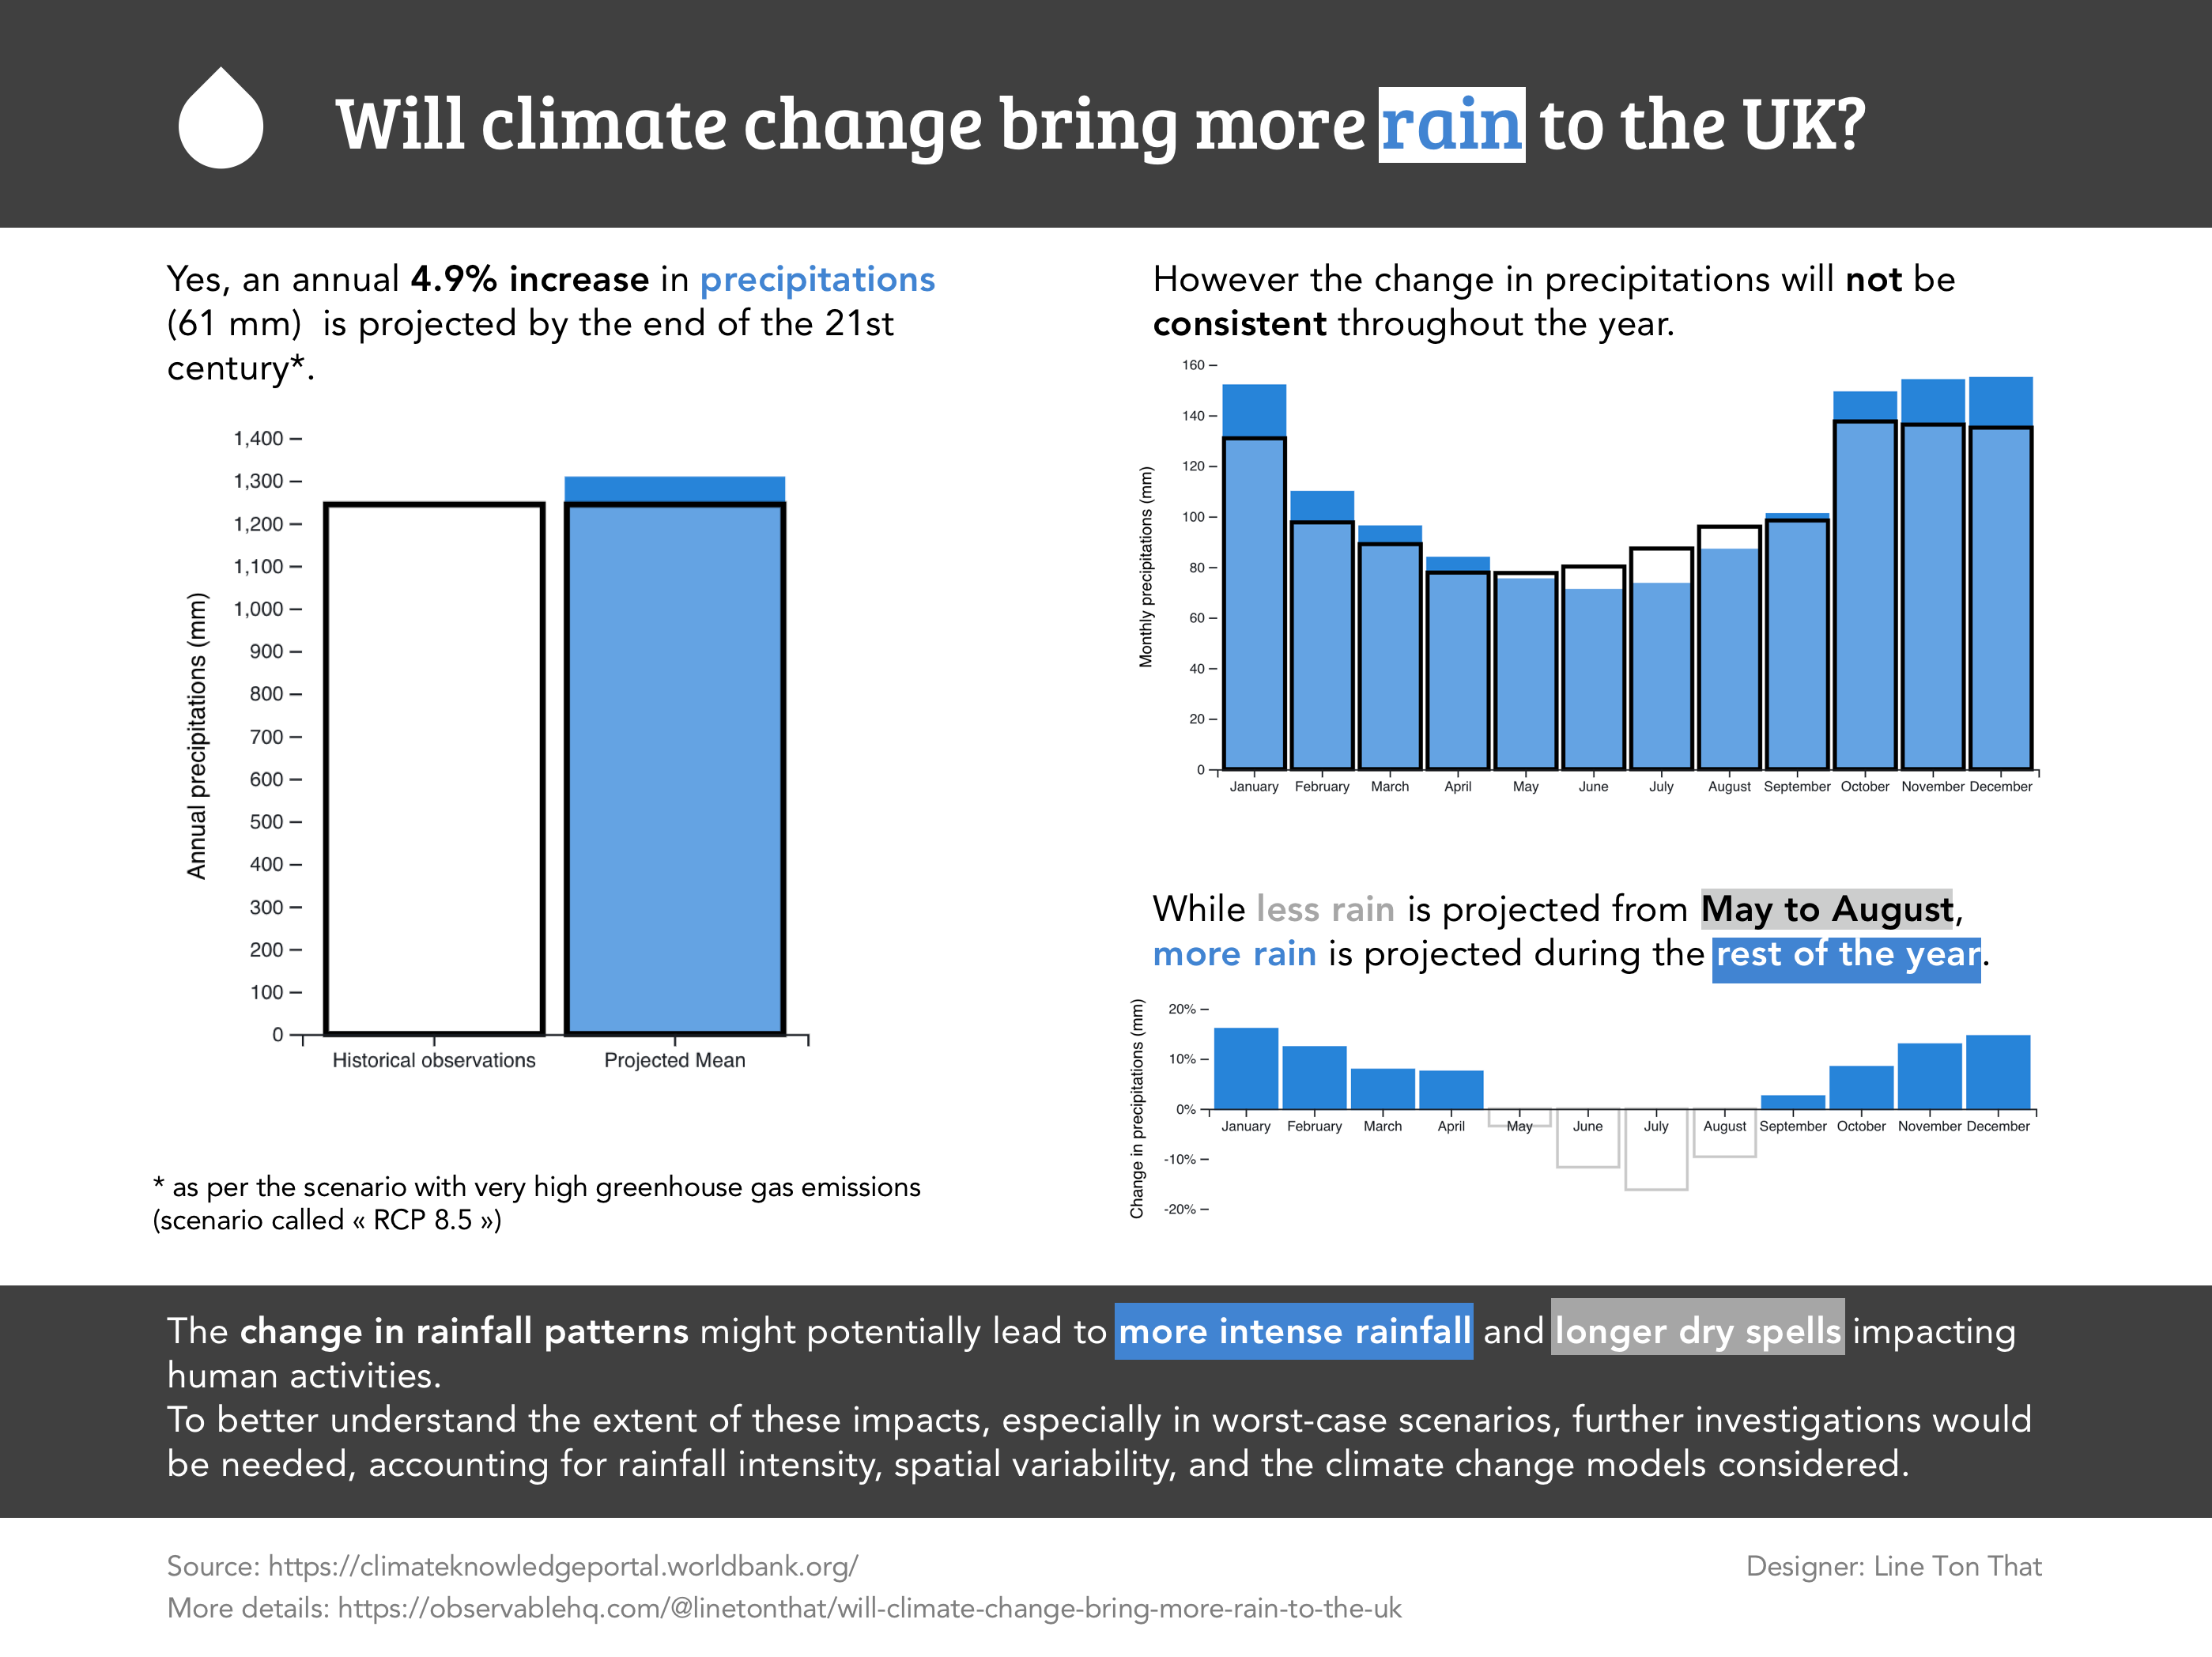
Scrollytelling had been on my wishlist for some time. I love this method as it allows guiding the reader step by step through the narrative, using annotations and animations. I’ve also submitted it to this month’s Storytelling with Data Challenge “annotate it!” . To test out the technique, I chose to reimagine a data visualization that was mostly static. Here is its summary:
The result
 See the complete scrollytelling version here. NB: This version is best viewed on a desktop computer (or at least on a screen 1100 pixels wide). The corresponding code is available here.
The challenges
There were several challenges I needed to overcome to create the scrollytelling version:
- Identify how to adapt the narrative to this specific format
- Identify a suitable library and understand how to apply it
- Create D3 data visualizations locally (using promises)
- Add interactivity to the visuals
- Publish it online
I’m writing this post to help anyone facing similar challenges. I assume that you’re already familiar with some D3, javascript, HTML and CSS.
Identify how to adapt the narrative to this specific format
Scrollytelling allows the story to be broken down into short stages, with animations used to highlight specific points. Although, it’s not scrollytelling per se, these two aspects have been used in this piece by the Pudding Cool. I love how animations are used to illustrate Ali Wong’s structure of stand up comedy.
Using sketches and draft.io, I have identified the main points to emphasize in the narrative. I kept the main structure using 3 illustrated sections: annual precipitations, monthly precipitations, and monthly variations.
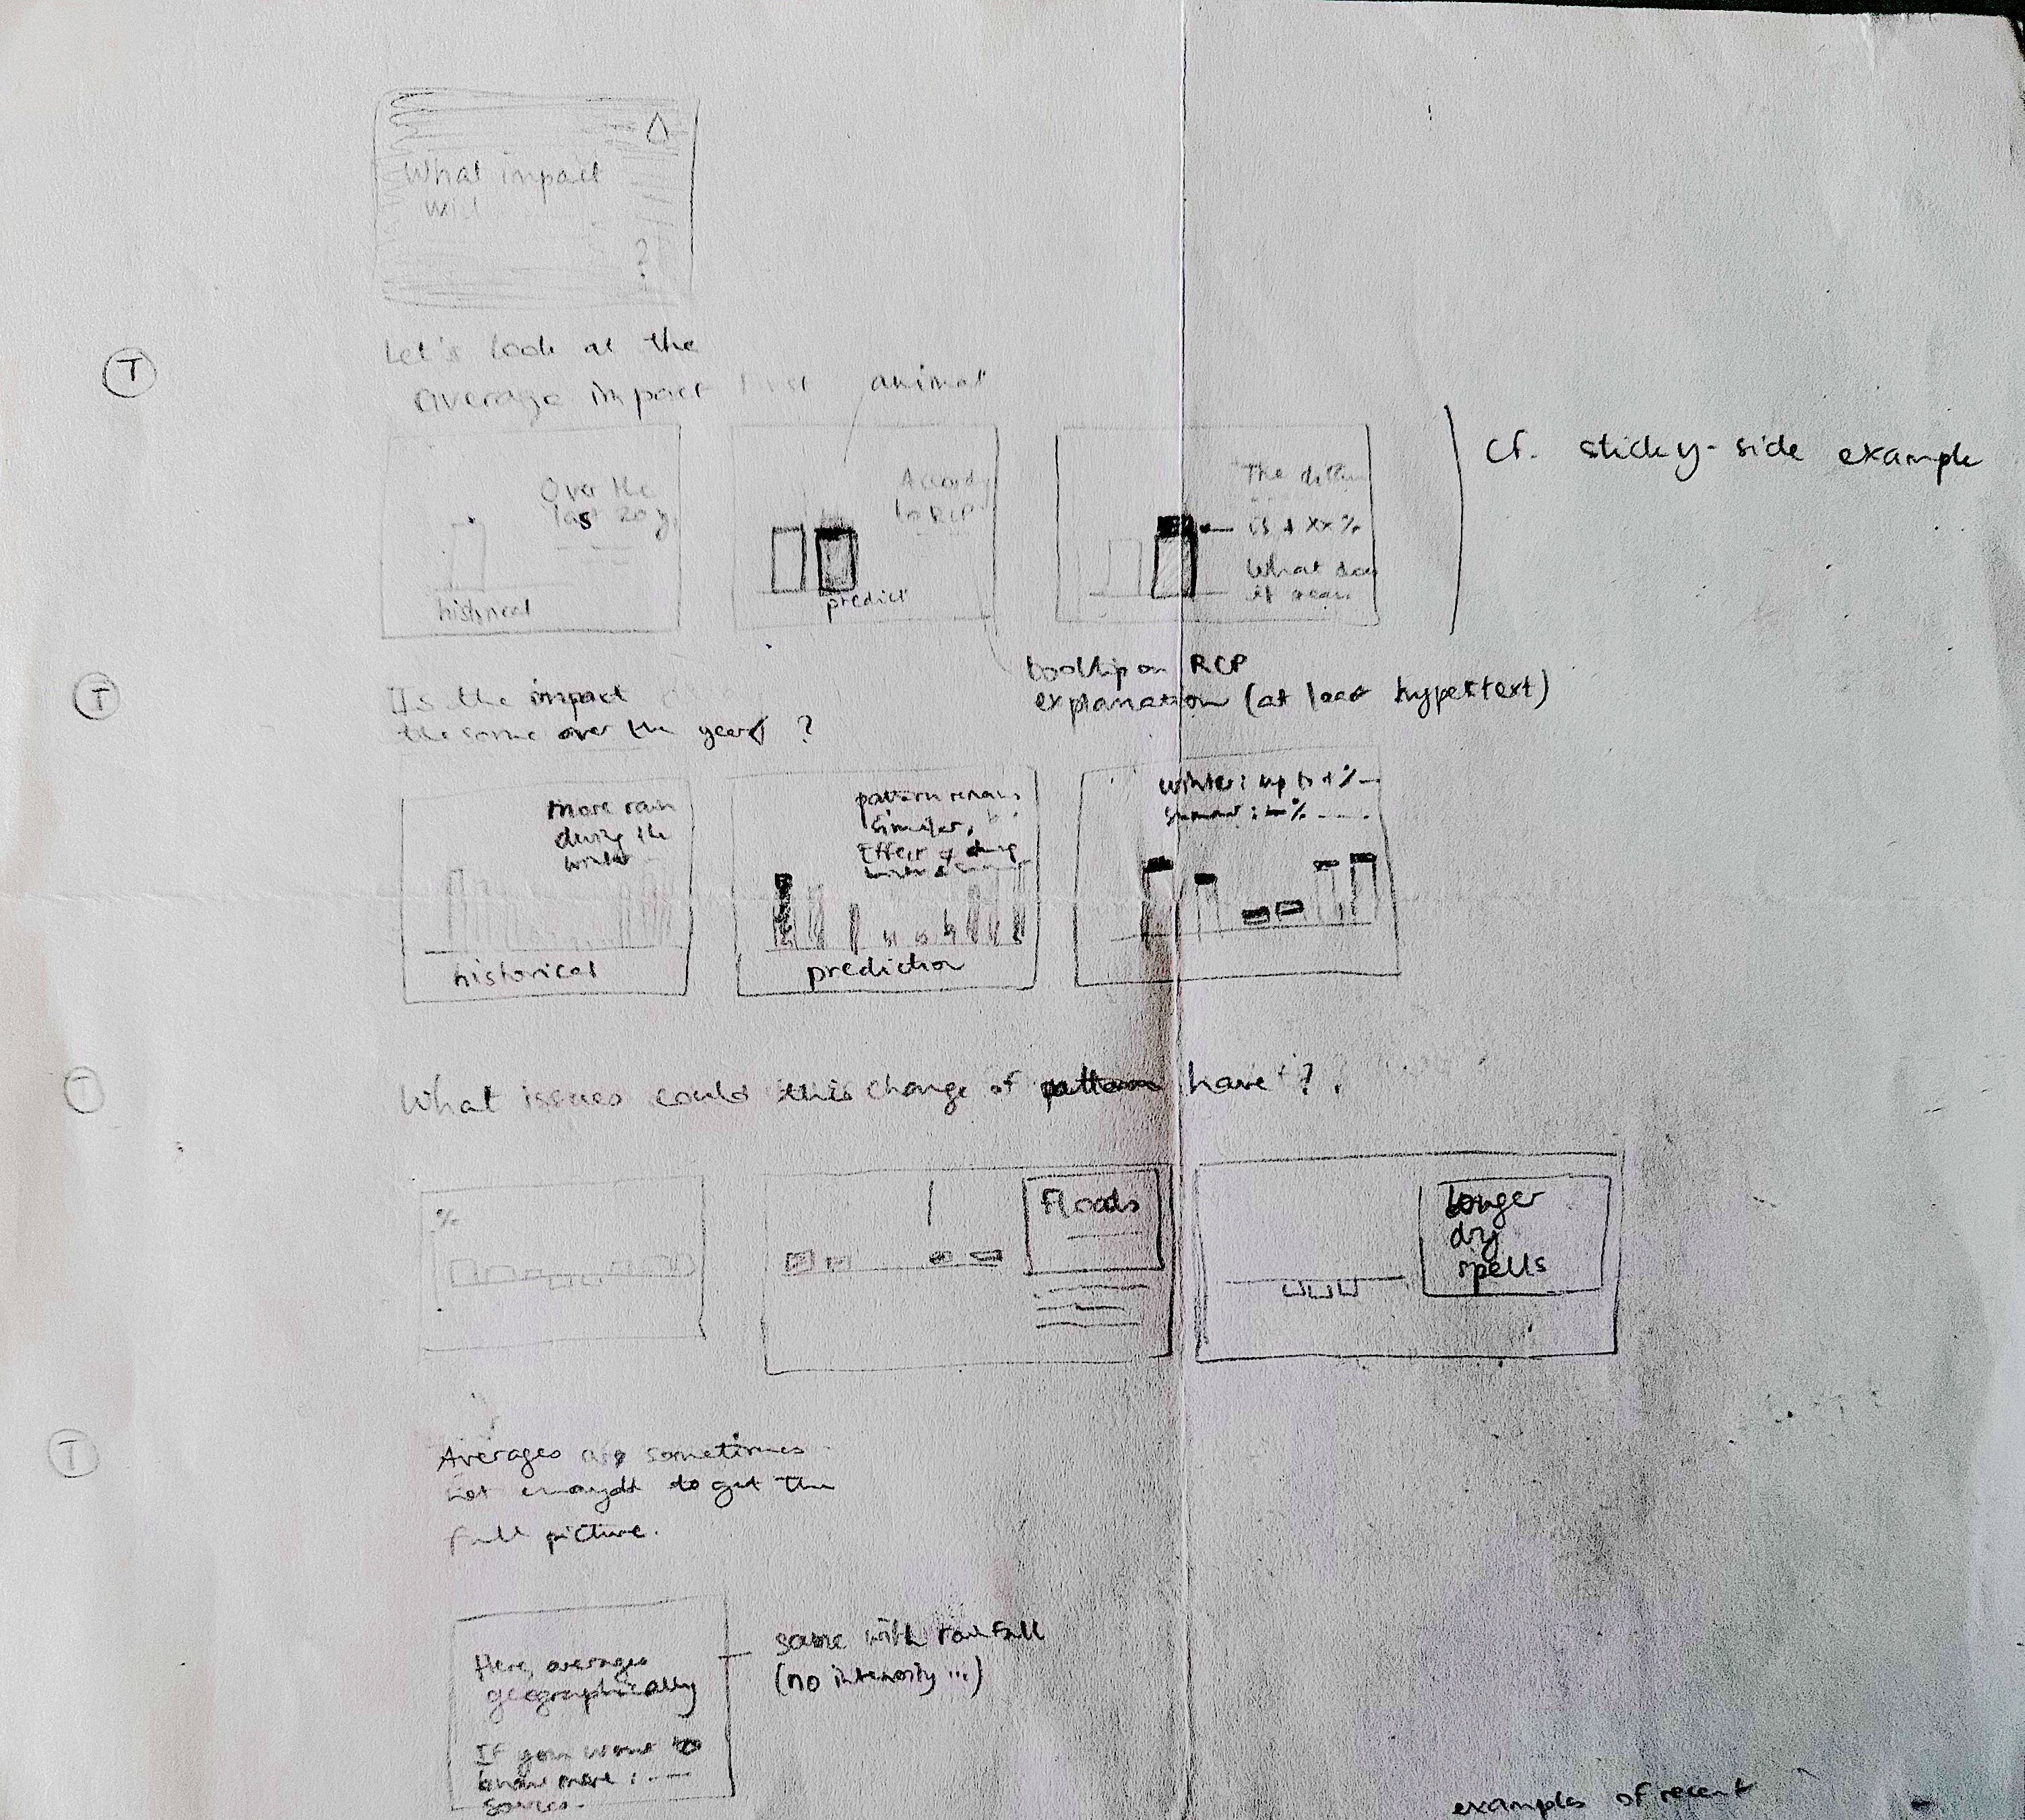
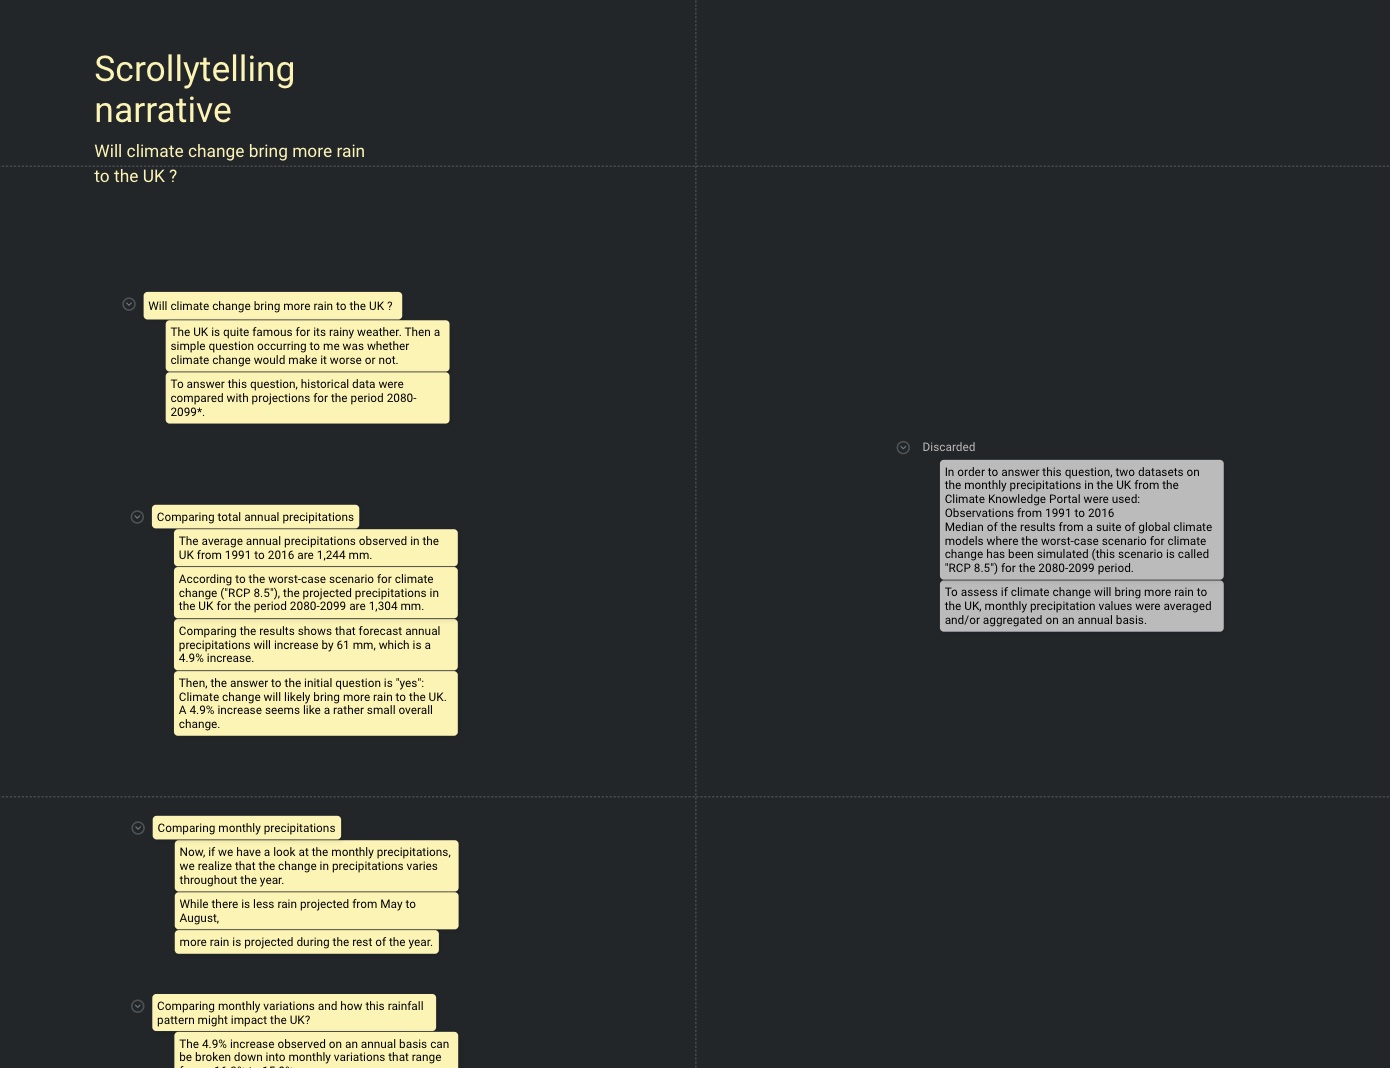
To make the most of scrollytelling, I broke down the figure in each illustrated section into different annotated versions to:
- Highlight specific figures (e.g. overall increase of 4.9%)
- Provide a legend (for example, rainfall projected in blue)
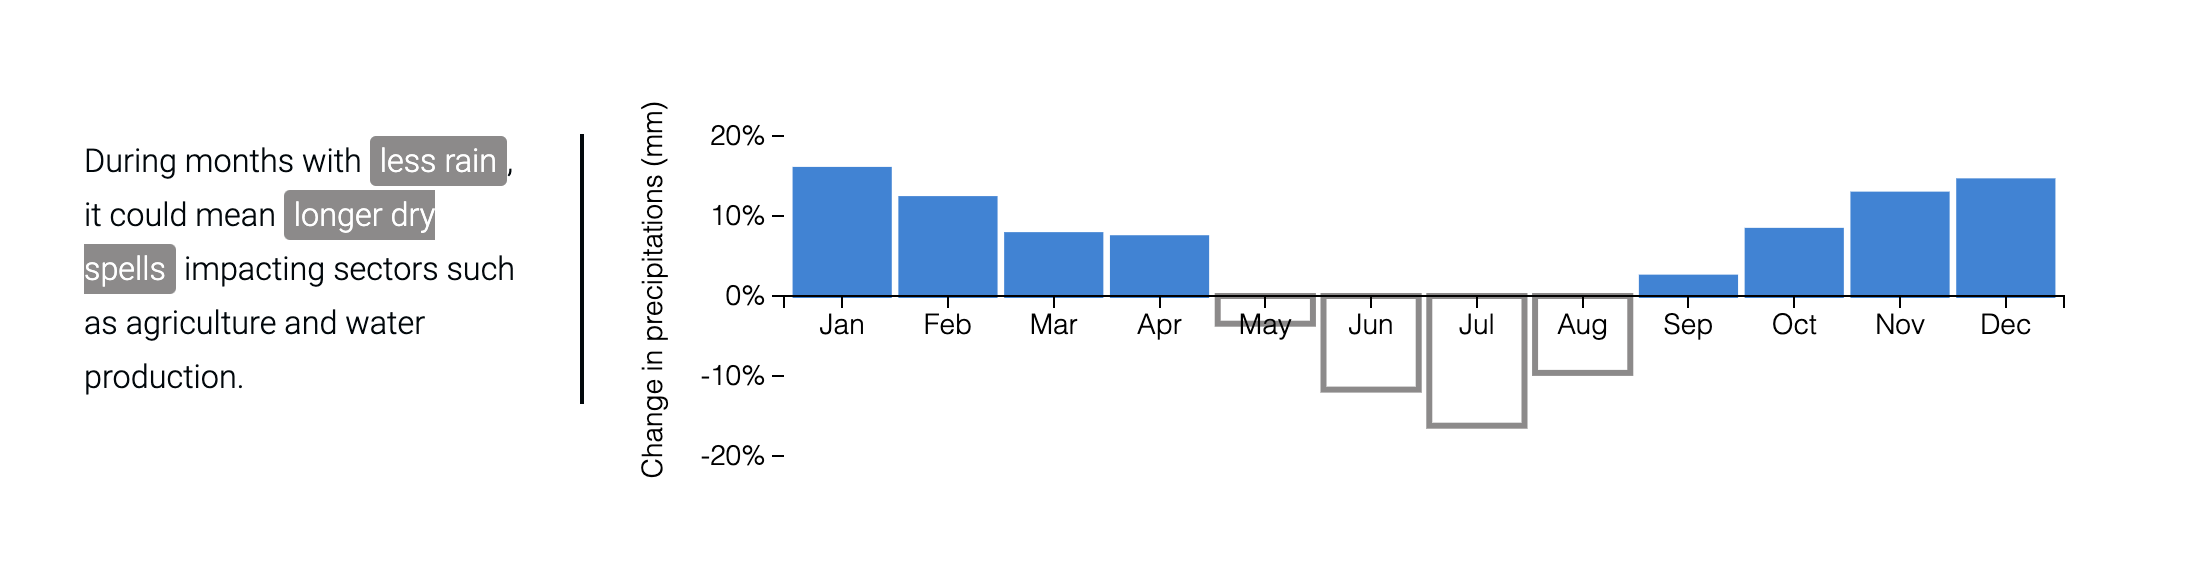
- Highlight specific features of the variation pattern (for example, the months with increase in rain)
- Highlight the potential impacts of pattern variation (e.g. longer dry spells)
Identify a suitable library and understand how to apply it
I found An Introduction to Scrollama.js by Russel Samora from the Pudding Cool, which explains “The what, why, and how to use scrollama.js for your next scrollytelling story”. The Sticky Side Example is the closest template to what I had in mind. It was implemented by Erik Driessen in his Scrollytelling with scrollama.js and d3.js (demo). His github repository was of great help, as it also included custom CSS.
Since both resources explain well how to use Scrollama with D3.js, I focus below on the additions for my project.
Define different types of section in HTML
I needed 3 different scrollytelling sections separated by text-only sections. Then I created 2 types of section using 2 classes: “scrolly” and “generic”.
A section element (the parent container) of class “scrolly” contains:
- a
figureelement (the graphic container) containing adivelement (the graphic container) whose identifier (in the example below “annual_precipitations”) will be used as a reference when creating the graphic. - an
articleelement (scroll text container) containing severaldivelements with class “step” which contains the text for each of the scrollytelling step.
<section class="scrolly" id="scrolly">
<figure>
<div id="annual_precipitations"></div>
</figure>
<article>
<div class="step" data-step="1">
<p>
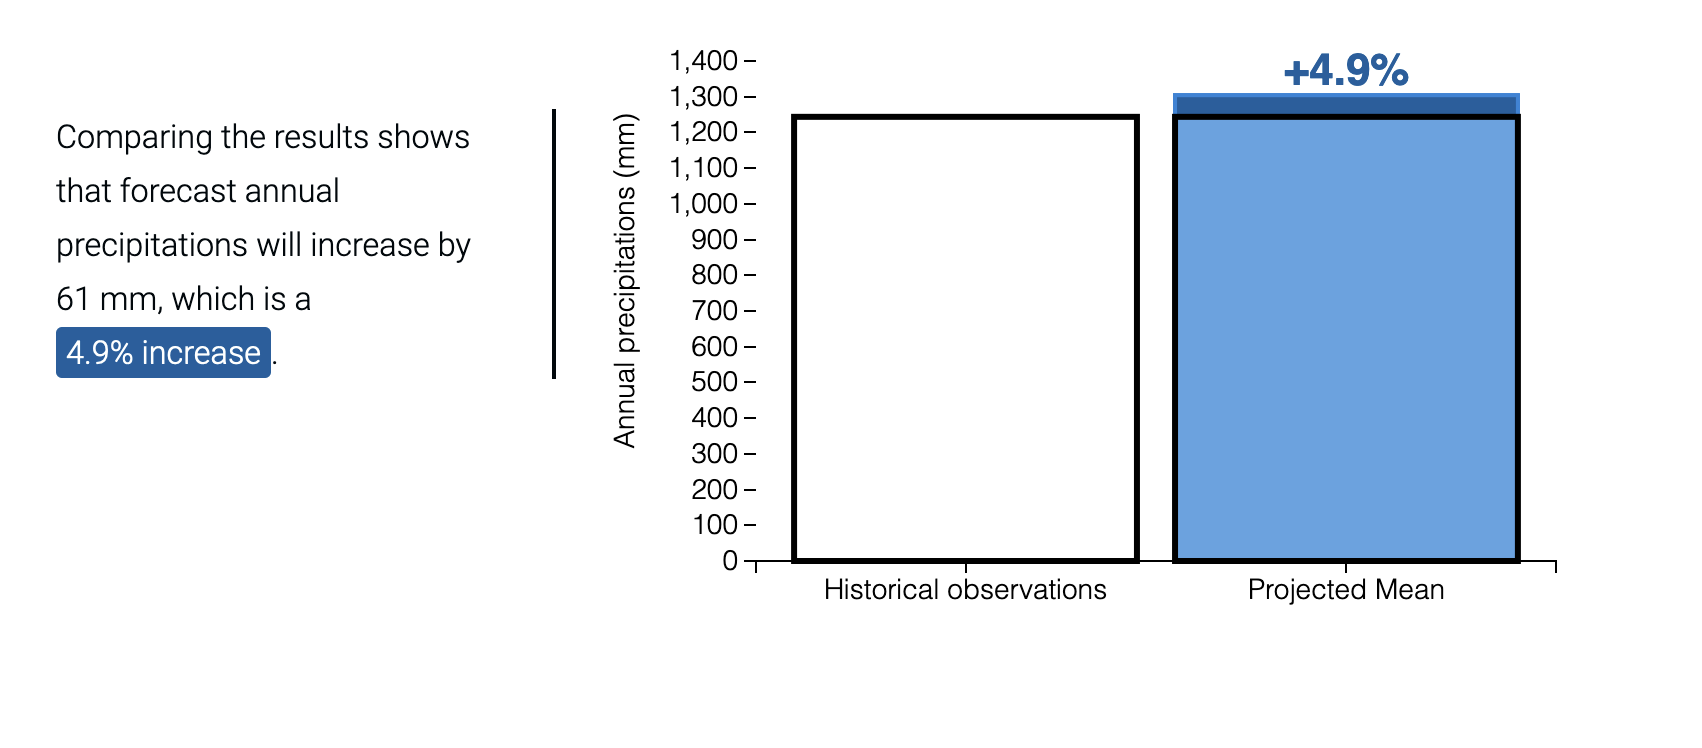
The average annual precipitations observed in the UK from
1991 to 2016 are 1,244 mm.
</p>
</div>
<div class="step" data-step="2">
<p>
According to the worst-case scenario for climate change ("RCP 8.5"),
the <span class="projected">projected precipitations</span> in the UK for the period 2080-2099 are
<span class="projected">1,304 mm</span>.
</p>
</div>
<div class="step" data-step="3">
<p>
Comparing the results shows that forecast annual precipitations will increase by 61 mm,
which is a <span class="rainier">4.9% increase</span>.
</p>
</div>
</article>
</section>
NB: I created several classes to highlight specific words in the scrolled text, when the step is active. The formatting is defined in the CSS file.
Adapt the CSS file
To create a consistent layout:
- Add the references to the additional sections and charts.
#scrolly, #scrolly2, #scrolly3 {
    width: 1100px;
    margin: 0 auto;
    position: relative;
}

#annual_precipitations, #monthly_precipitations, #monthly_variations{
    float: right;
}
- Define the aspect of highlighted text when the step is active.
.step.is-active span.projected {
  background: #2783d9;
  color: white;
  -webkit-border-radius: 3px;
  padding: 3px 5px;
}
Adjust the scrollama settings
The scrollama settings are defined in the scrollama-settings.js file. To display different scrollytelling figures I modified the selection of scrolly objects to account for multiple instances using selectAll (instead of select) and the reference to their class “scrolly” (instead of their ID).
// selecting all objects (sections) of class "scrolly" (there are 3 scrolly sections, 1 per figure)
var scrolly = main.selectAll(".scrolly");

// if you need to only select one element, go with the below line
// var scrolly = main.select("#scrolly");
Then, in the init function, the reference to the scrollytelling step is based on the “scrolly” class (.scrolly) of the scrolly container, instead of than its ID (#scrolly). This allows referencing several scrollytelling sections instead of just one.
scroller
    .setup({
        step: ".scrolly article .step",
        offset: 0.5,
        debug: false
    })
I also had to review how to flag the active step as the initial code didn’t work in the handleStepEnter function.
// flag the current step (div) as active
response.element.classList.add("is-active"); // used this function as the below one was not working
// step.classed("is-active", function(d, i) {
//     return i === currentIndex;
// });
Then I had to add a handleStepExit function to remove the active flag from current step.
function handleStepExit(response) {
    // response = { element, direction, index }
    console.log(response);
    // remove active flag from current step
    response.element.classList.remove("is-active");
}
This function is added in the callback functions listed in the init function using .onStepExit(handleStepExit).
scroller
    .setup({
        step: ".scrolly article .step",
        offset: 0.5,
        debug: false
    })
    .onStepEnter(handleStepEnter)
    .onStepExit(handleStepExit);// add the handle step exit (to remove "is-active" flag)
Create D3 data visualizations locally (using promises)
I first created the data visualizations using an Observable notebook. It was convenient to prototype and share them online. They were already coded using the D3 library. All I needed to do was to adapt the code for inclusion in my own website.
The only problem? The version 5 of D3 introduced promises a while back and it changed the way we use datasets. And well, I didn’t know how to deal with promises…
... so this is how I felt at this point! (Credits: GIPHY)
After some research and trial and errors, I finally created a first variable called dataset holding my Promise using D3’s d3.csv function.
// read in the data
const dataset = d3.csv("./../data/UK_precipitations.csv", d3.autoType);
I then chain this promise with an anonymous function to create my chart. I also created global scale functions to use them in my different charts.
const chartBarMonthly = dataset.then(function(data) {
  // use scale functions
  const x = xScale(data);
  const yMonthly = yScaleMonthly(data);

  // create a SVG element
  const svg = d3.select("#monthly_precipitations") // link it to the relevant div
    .append("svg")
    .attr("width", totalWidth)
    .attr("height", h);

  // create bars
  // projected precipitations (hidden at first)
  svg.append("g")
    .selectAll("rect")
    .data(data)
    .join("rect")
    .attr("class","monthlyProjected")
      .attr("x", d => x(d.Month))
      .attr("y", d => yMonthly(0))
      .attr("height", 0) // set bar height to 0 to hide
      .attr("width", x.bandwidth())
      .attr("stroke", colorLightBlueAlpha)
      .attr("stroke-width", 2)
      .attr("fill", colorLightBlueAlpha)

    // ...

}
I could check the result in my browser running a Python web server. After navigating to the right folder, I simply typed python3 -m http.server in my terminal window.
Well the static charts were re-created locally. Now, it was time to add interactivity.
Add interactivity to the visuals
Animations
I defined the animation functions to apply at each scrollytelling stage using D3’s .transition. This function is pretty magic to me! It allows transitioning between different values of a chart’s features. I used the default setting. I set the duration at 1500 ms using .duration(1500). So you just need to select the right object (using a selection by class here) and call these two functions to create an animation. Pretty amazing!
I followed Erik Driessen’s advice to test the animations separately (rather than at the same time as all the scrollytelling).
function showProjectedMonthlyPrecipitations() {

	dataset.then(function(data) {

			// use scale function
			const yMonthly = yScaleMonthly(data);

			d3.selectAll(".monthlyProjected")
				.transition()
				.duration(1500)
				.attr("y", d => yMonthly(d.Projected))
				.attr("height", d => yMonthly(0) - yMonthly(d.Projected))
		})
}
Once the animation functions are defined, the step when they’re called need to be defined in the handleStepEnter function in the scrollama-settings.js file. This defines how scroll will be handled and what animations will be fired at the different steps. Animation functions were defined to accommodate for scrolling in both up and down directions.
// scrollama event handlers

/*
scrollama magic happens here:
- based on the index, trigger a certain function from d3 script files
- sometimes only fire an event when going down or up in the story
*/
function handleStepEnter(response) {

    console.log(response);
    // response = { element, direction, index }
    let currentIndex = response.index;
    let currentDirection = response.direction;

    // flag the current step (div) as active
    response.element.classList.add("is-active"); // used this function as the below one was not working
    // step.classed("is-active", function(d, i) {
    //     return i === currentIndex;
    // });

    // update graphic based on step
    switch(currentIndex){
        case 0:
            if(currentDirection === 'up'){
                hideProjectedAnnualPrecipitations()
            } else {

            }
            break;
        case 1:
            if(currentDirection === 'up'){
                hideProjectedIncrease();
            } else {
                showProjectedAnnualPrecipitations()
            }
            break;
        case 2:
            if(currentDirection === 'up'){

            } else {
                showProjectedIncrease();
            }
            break;


        default:
            break;
    }

}
Tooltips using div
I followed Yan Holtz’s great post to create tooltips. I had some trouble reproducing the same result. I managed to solve the issue by using the D3 v7 (instead of D3 v5) and using .attr("style", "position: absolute; opacity: 0;") . The absolute position is critical!
// define tooltip
const tooltip = d3.select("#monthly_precipitations") // link it to the relevant div
      .append("div")
        .attr("id","tootip2")
        .attr("style", "position: absolute; opacity: 0;") // /!\ use absolute position (else issue with positioning)
        .attr("class", "tooltip")
        .style("background-color", lightBlack)
        .style("border-radius", "5px")
        .style("padding", "10px")
        .style("color", "white")
Publish it online
I created a new github account to use GitHub Pages to host the project online. To be able to push my local repository to the github repository, I re-configured Git Credential Manager using git-credential-manager github login.
To streamline my project structure, I follow a structure similar to the one used by Nadieh Bremer in this project.