Designed to be printed
When I design personal data visualizations, I usually imagine them printed on paper, although they mostly remain in their digital format.
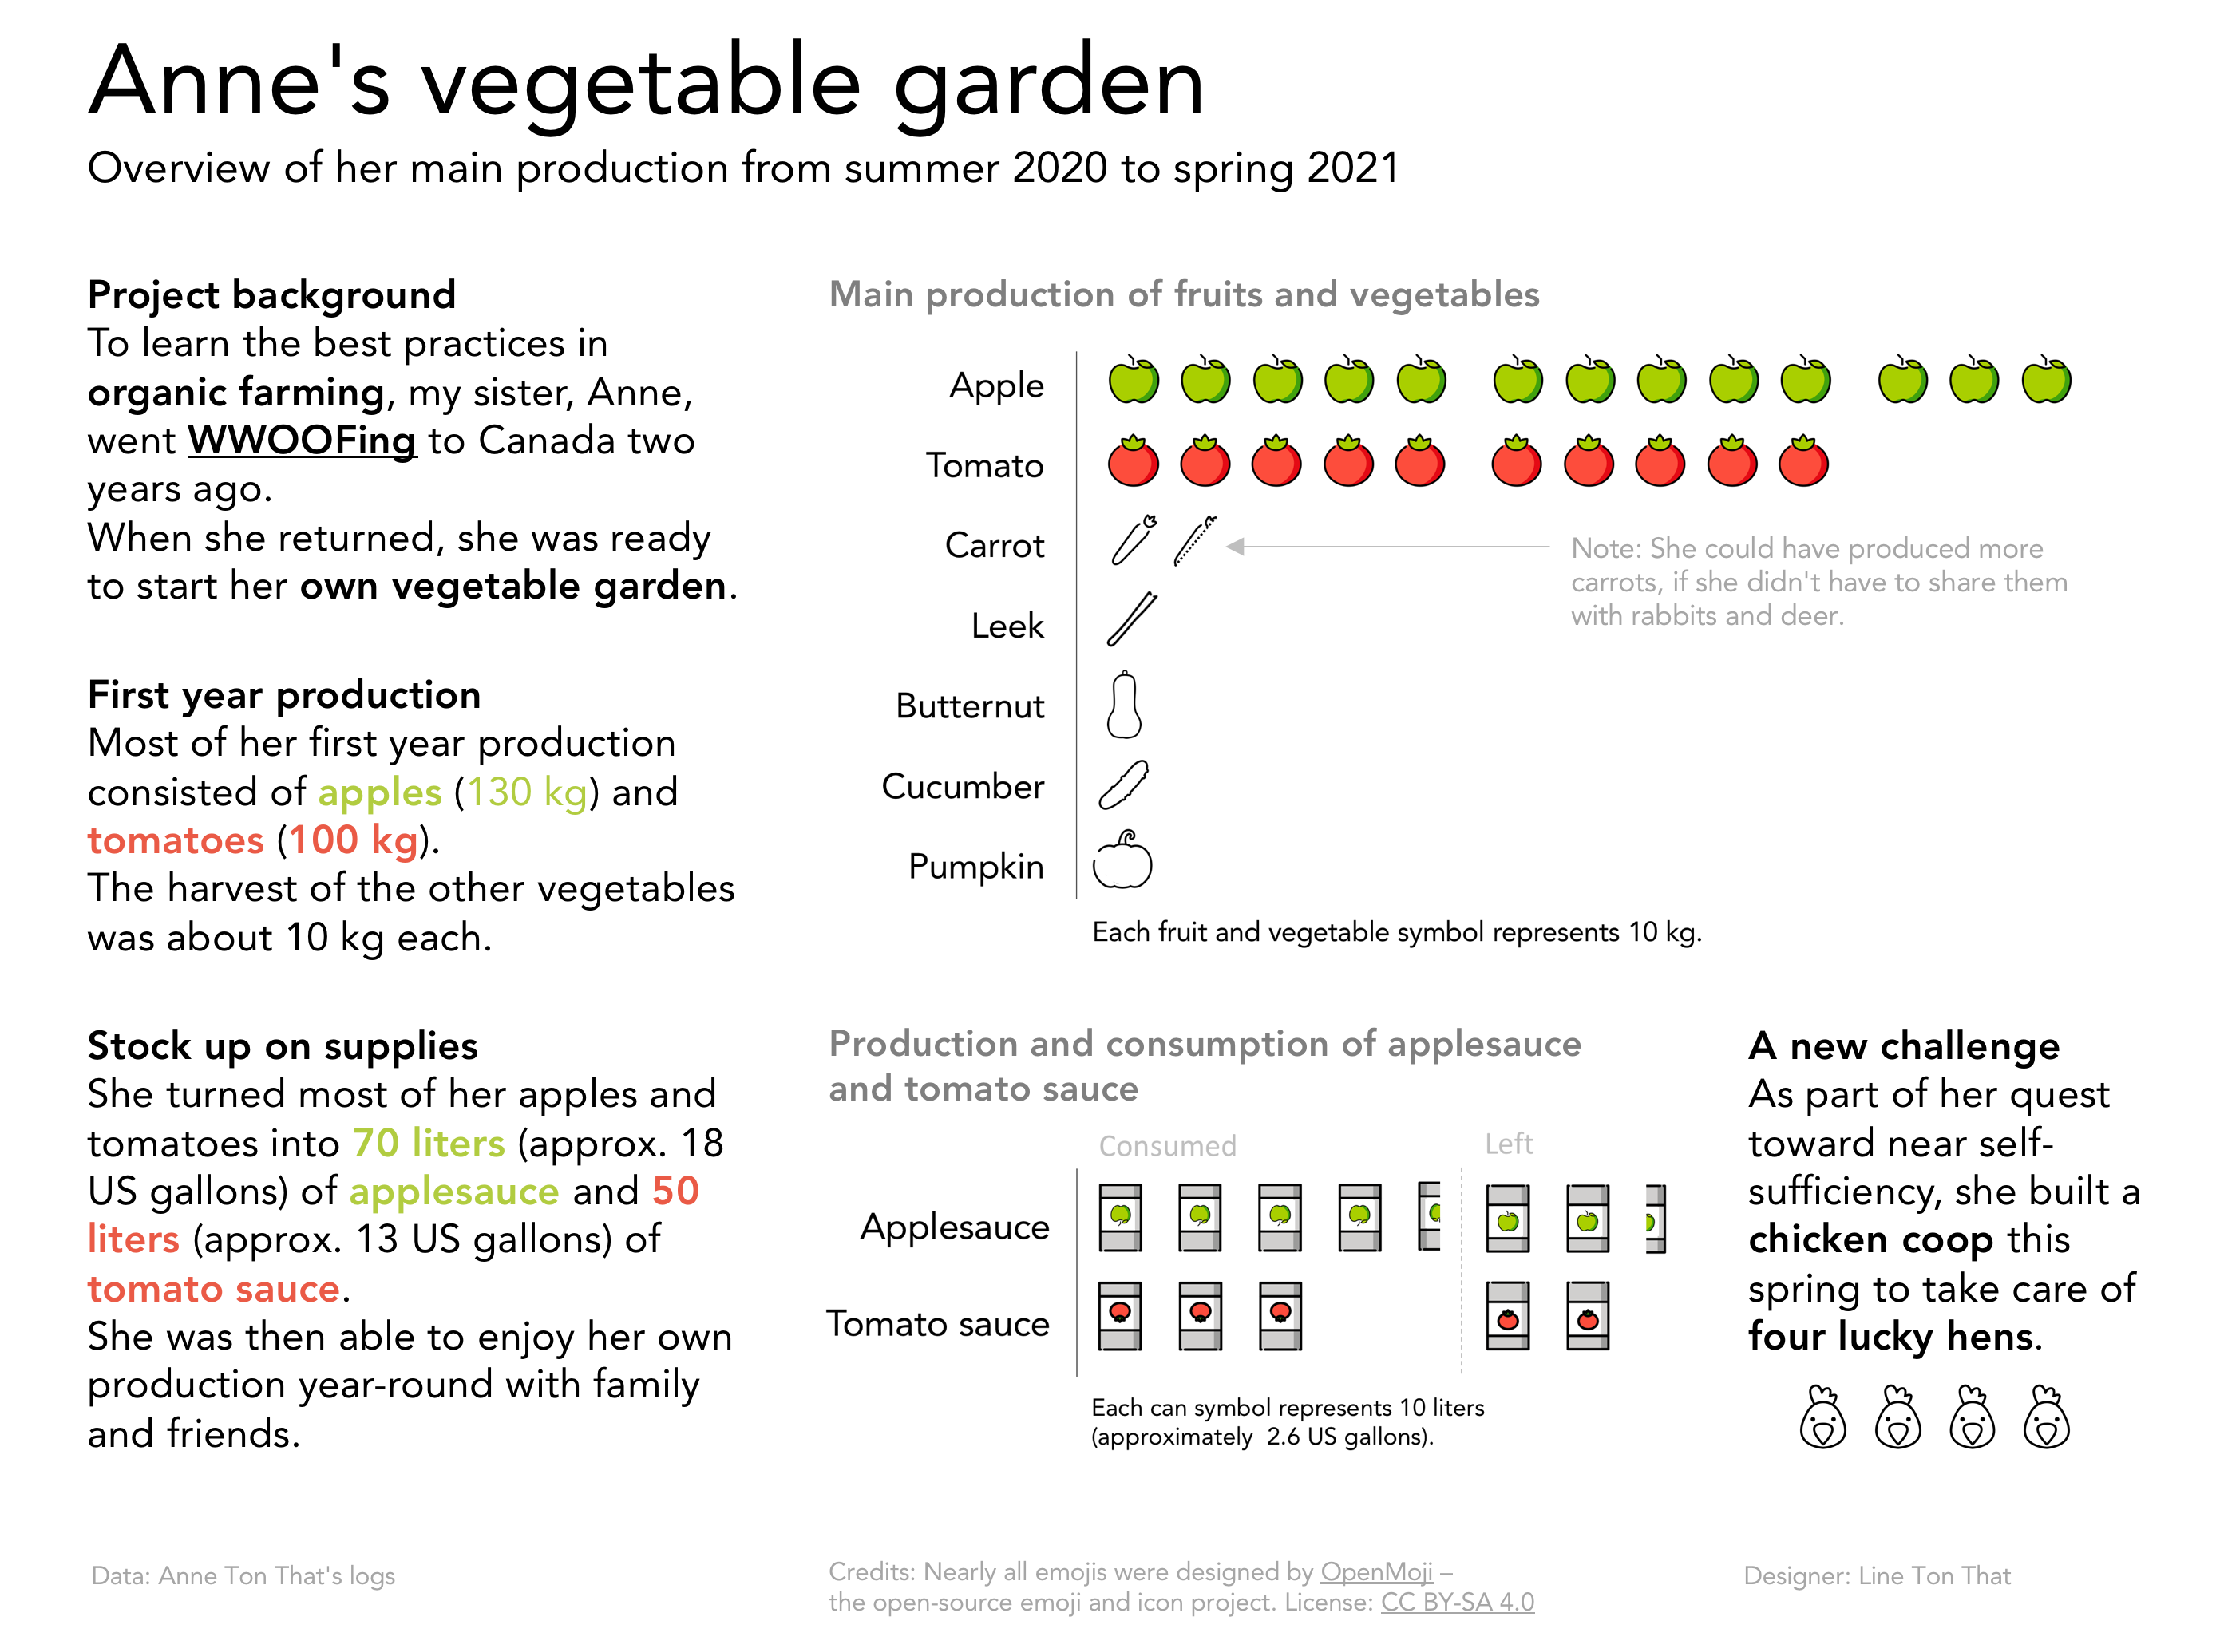
However, there are a few that I would like to see materialized. For example, I printed my sister’s vegetable garden data visualization for her. In a way, it’s a reminder of what she accomplished in the first year of her vegetable garden. It was easy to do, as it’s A4 size (the visualization was done with PowerPoint).
Initial version in digital format
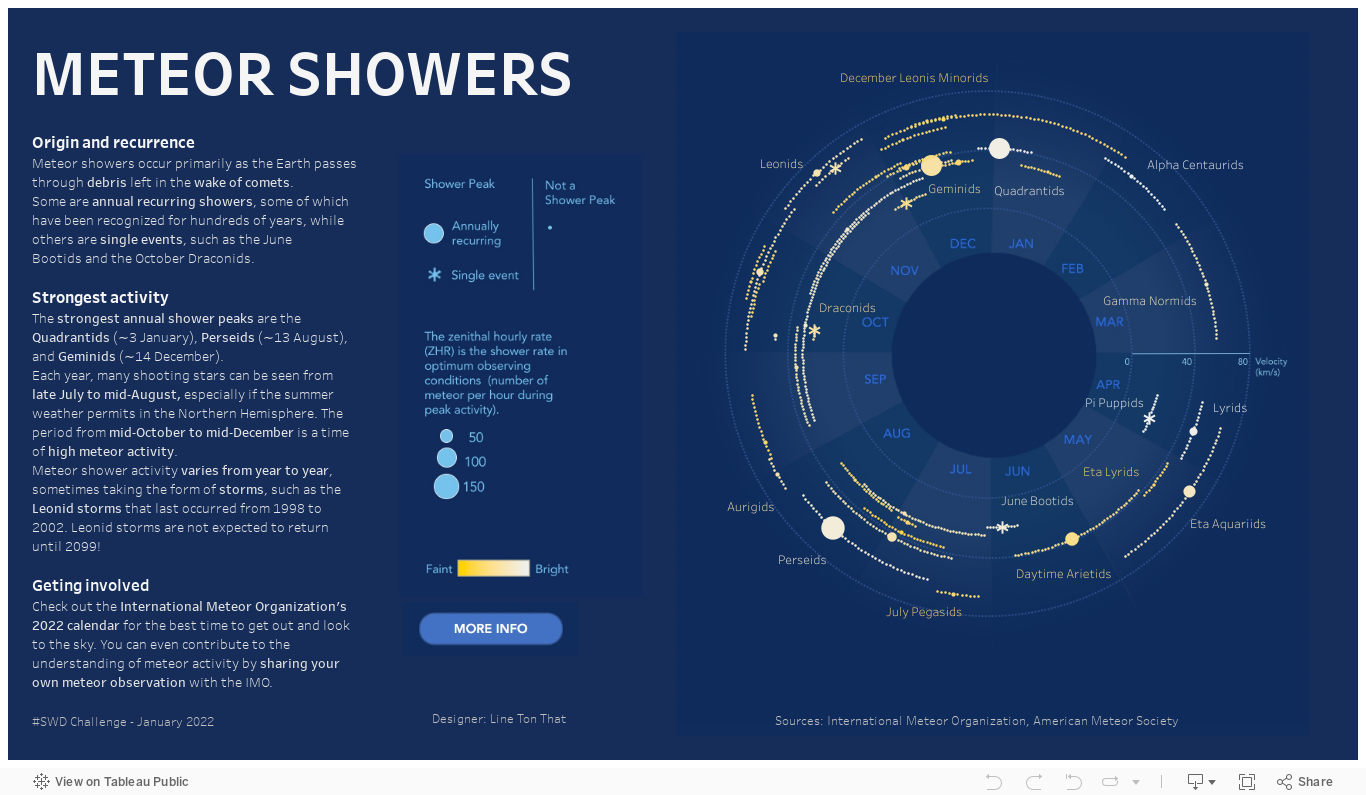
Earlier this year, I worked on a meteor shower calendar. This version was designed to be interactive, because of its format (intended to fit on a computer screen), where it is difficult to display all the names of the showers on the graph. You could list them on the side, as Michela Lazzaroni did in a data visualization that inspired me a lot. But in my initial version, there wasn’t much space, and I prefer to have the labels close to the associated visual cue to avoid back and forth eye movement.
Turning it into a poster format
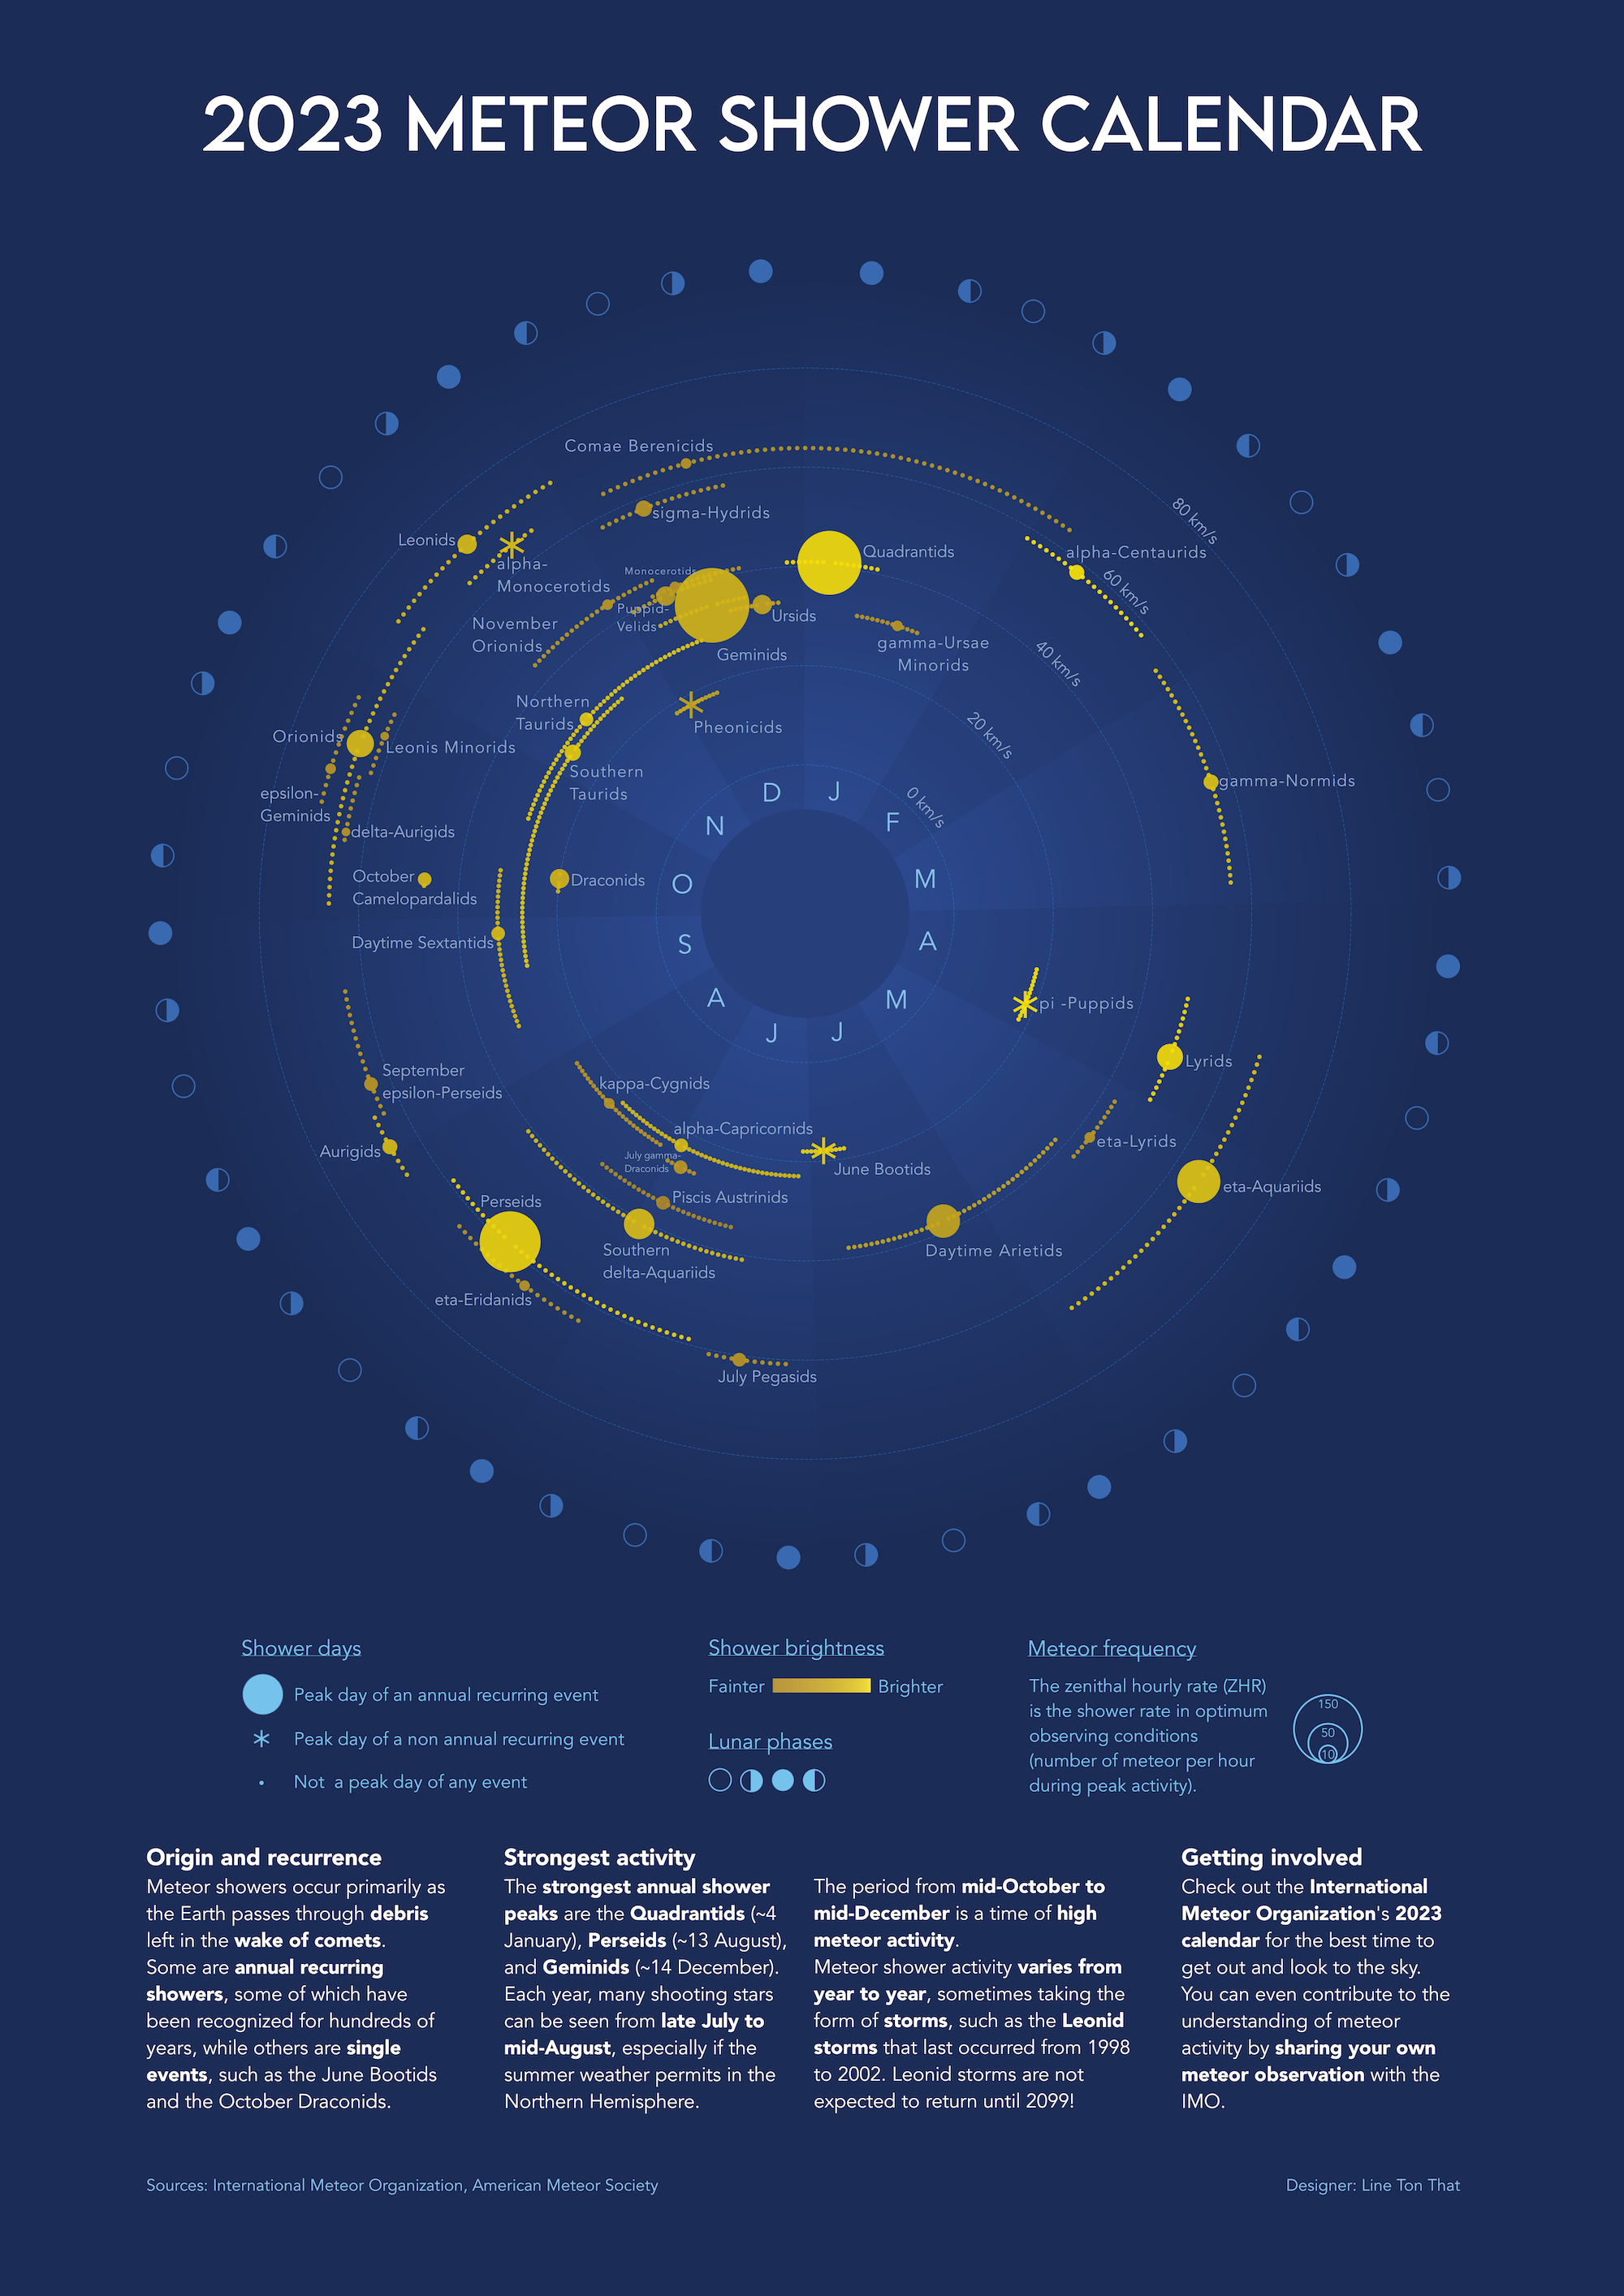
I had the idea of turning the data visualization into a poster, where I would have enough space to display all the origins of the showers, and I could hang it on my wall as a reminder about the date of the meteor showers. As I was considering a large poster size (A2 size), I realized that in order to get a good resolution, it would be too difficult for me to work directly from the existing data visualization in Tableau and change its size. I decided to use D3.js instead to build the whole poster and in particular to build the background color gradient (I had previously created it using a graphic editor).
The new version
In this new version, I added the moon phases. This was part of my initial ideas, but I didn’t have time to include it in the initial version. It became a top priority, after I painfully realized this summer that the full moon on the day of the Perseid’s peak was not ideal :-/. Due to time constraints, I was not able to build it entirely using D3.js. The final design was made with Gimp, to add the title, captions, explanations and credits.
Here is a preview of the poster (next year’s data!):
You can find the high resolution version here. If you use it at home, I’d be happy to know :). Send me a message on Twitter or on LinkedIn.
Main data source: 2023 Meteor Shower Calendar from the International Meteor Organization.